

Foligno, Italy weather in August
Historical temperature average in August
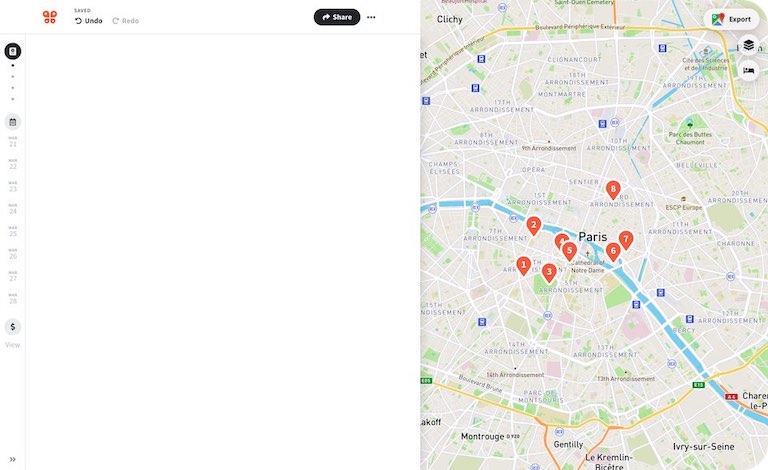
- Itinerary + map in one view
- Live collaboration
- Auto-import hotels and reservations
- Optimize your route
- Offline access on mobile
- Optimize your route
- See time and distance between all your places

General weather summary
Table of contents
What is the average temperature in August
The average temperature in Foligno in August for a typical day ranges from a high of 89°F (32°C) to a low of 64°F (18°C). Some would describe it as very warm.
For comparison, the hottest month in Foligno, August, has days with highs of 89°F (32°C) and lows of 64°F (18°C). The coldest month, January has days with highs of 47°F (8°C) and lows of 32°F (0°C). This graph shows how an average day looks like in Foligno in August based on historical data.
Visiting Foligno? See our Foligno Trip Planner.
How much does it rain in August
In Foligno in August, there's a 9% chance of rain on an average day. And on the average day it rains or snows, we get 0.45 in (11.5 mm) of precipitation. In more common terms of how much that is, some would describe it as light rain.
The wettest month in Foligno is May where a typical day has a 31% chance of precipitation and gets 0.02 inches (0.6 mm) of precipitation, while the dryest month in Foligno is August where a typical day has a 9% chance of precipitation and gets 0.04 inches (0.9 mm) of precipitation. These graphs show the probability of it raining/snowing in August and the amount of rainfall.


How cloudy is Foligno in August
When is sunrise and sunset in August
The average day in Foligno during August has 13.9 hours of daylight, with sunrise at 6:14 AM and sunset at 8:10 PM.
The day with the longest amount of daylight in Foligno is June 20th with 15.4 hours while December 21st has the shortest amount of daylight with only 9.0 hours.
This graph shows the average amount of daylight in Foligno in August based on historical data.
How humid is it in August
How windy is it in August
What to wear in August
What's the weather like in Foligno the rest of the year
We've collected the weather data for Foligno during all other months of the year too:
- Weather in Foligno in January
- Weather in Foligno in February
- Weather in Foligno in March
- Weather in Foligno in April
- Weather in Foligno in May
- Weather in Foligno in June
- Weather in Foligno in July
- Weather in Foligno in September
- Weather in Foligno in October
- Weather in Foligno in November
- Weather in Foligno in December
Where does this data come from
Weather data for Foligno was collected from the MERRA-2 project from NASA, which used a climate model combined with historical data from weather stations around the world to estimate what the conditions were like for every point on the Earth.
For all data based on historical data, we've averaged the data from the past 11 years (2010-2020). For example, for the hourly temperature at 10am, we've looked at the temperature at 10am on every day in August (e.g., August 1, August 2, etc. in 2010, 2011, etc.) and took the arithmetic mean. We did not smooth the data, so for example, our daily temperature line will have some randomness due to the fact that weather is random in the first place.
Popular road trips from Foligno
All road trips from Foligno
Explore nearby places
- Foligno
- Sant'Eraclio
- Spello
- Pale
- Bevagna
- Montefalco
- Capodacqua
- Trevi
- Cantalupo
- Cannara
- Rivotorto
- Valtopina
- Gualdo Cattaneo
- Sant'Apollinare
- Assisi
- Tordandrea
- Collemancio
- Castel Ritaldi
- Santa Maria degli Angeli
- Campello sul Clitunno
- Camporoppolo
- Giano dell'Umbria
- Colfiorito
- Bastia Umbra
- Nocera Umbra
- Bettona
- Sellano
- Saragano
- Gaglietole
- San Terenziano
- Brufa
All related maps of Foligno
- Map of Foligno
- Map of Sant'Eraclio
- Map of Spello
- Map of Pale
- Map of Bevagna
- Map of Montefalco
- Map of Capodacqua
- Map of Trevi
- Map of Cantalupo
- Map of Cannara
- Map of Rivotorto
- Map of Valtopina
- Map of Gualdo Cattaneo
- Map of Sant'Apollinare
- Map of Assisi
- Map of Tordandrea
- Map of Collemancio
- Map of Castel Ritaldi
- Map of Santa Maria degli Angeli
- Map of Campello sul Clitunno
- Map of Camporoppolo
- Map of Giano dell'Umbria
- Map of Colfiorito
- Map of Bastia Umbra
- Map of Nocera Umbra
- Map of Bettona
- Map of Sellano
- Map of Saragano
- Map of Gaglietole
- Map of San Terenziano
- Map of Brufa
Foligno throughout the year
Looking for day-by-day itineraries in Foligno?
Get inspired for your trip to Foligno with our curated itineraries that are jam-packed with popular attractions everyday! Check them out here:
Weather information for nearby cities
- Weather in Pale in August
- Weather in Bevagna in August
- Weather in Montefalco in August
- Weather in Capodacqua in August
- Weather in Trevi in August
- Weather in Cantalupo in August
- Weather in Cannara in August
- Weather in Rivotorto in August
- Weather in Gualdo Cattaneo in August
- Weather in Sant'Apollinare in August
- Weather in Assisi in August
- Weather in Tordandrea in August
- Weather in Collemancio in August
- Weather in Santa Maria degli Angeli in August
- Weather in Campello sul Clitunno in August
- Weather in Camporoppolo in August
- Weather in Giano dell'Umbria in August
- Weather in Colfiorito in August
- Weather in Bastia Umbra in August
- Weather in Nocera Umbra in August
- Weather in Bettona in August
- Weather in Sellano in August
- Weather in Saragano in August
- Weather in Gaglietole in August
- Weather in San Terenziano in August
- Weather in Brufa in August